• Skip to main content
Mary Wiseman
  • START HERE
  • BLOG
  • SPEAKER
  • VIDEOS
  • ABOUT

Infographics

36 UIs In 30 Locations

April 9, 2012 by izzy

When to know enough is just enough. Ericsson had too much information and needed a message to communicate how a multi-purpose, multi-technology network node enables operators to meet their three priorities in relation to data traffic explosion: differentiation, control and monetization.

The above video is work that makes you jealous, inspires and does both simultaneously.  The beauty of this video is that it is a great example of the changing nature of how instruction can communicate an idea [not just a product].  It shows how Ericsson moves data around, and why it matters.

The House of Radon did the creative work and really hit the nail on making sense out of a concept. The video’s message “appeals to the senses.” Data, nodes, operators, differentiation–all of these ideas in Ericsson’s brief are just so much insubstantial vapor. House of Radon’s video translates them into snappy factoids, which helps. But the idea of embedding them into physically appealing touchscreen interfaces–and then embedding those into a series of viscerally evocative first-person live-action scenelets, where just a hint of sound effects and out-of-focus background action instantly tells your five senses everything they need to know about what’s happening outside the edges of the frame–that’s what makes Ericsson’s brief make sense.

DATA IS EVERYWHERE NOW, AND THESE ZILLION INTERFACES MAKE YOU FEEL THAT IN YOUR BONES.

House of Radon’s relentless cutting from new interface/location to new interface/location, three dozen times, is an essential part of getting the message across. As more and more innovative companies find themselves “selling” invisible-but-essential ideas, this kind of advertising-as-sensemaking becomes more valuable than any glib “Got Milk?”-style product campaign ever could be. Does every spot need to cram in 30-odd interfaces and locations to make its point? Of course not. But the designers behind this House of Radon spot know that, sometimes, “too much” is just enough.

Filed Under: 21st Century Learning Skills, Creativity, critical thinking, Design, Infographics, Inspiration, instructional design, User Interface [UI], Video Tagged With: 21st Century Learning Skills, Creativity, critical thinking, Design, Inspiration, instructional design, User Interface [UI]

Big Data and Infographic Thinking

February 13, 2012 by izzy

I’ve always been a lover of great infographics ever since being introduced to Edward Tufts. I think this stems from my life-long-love of maps.  More and more data is being turned into shorthand to aid in advancing trends in all areas of our lives.  These types of presentations really help us understand our world and help us make decisions.


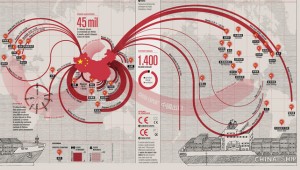
This one shows Chinese exports

Watch this brief video from Francesco Franchi, a master of information design. He talks about how you have to go beyond the picture and create an entirely different sort of experience that encourages critical thinking.

Francesco Franchi: On Visual Storytelling and New Languages in Journalism from Gestalten on Vimeo.

Sunday, The New York Times ran an article about Big Data. In it they talk about how “Data is in the driver’s seat. It’s there, it’s useful and it’s valuable, even hip.”   And infographics can really help us decipher information so it becomes useful to us.  For example, learning how pasta, not bacon makes us fat.  Or how to make the perfect cocktail. These are really fun and useful ways infographics help us.

Corporate America is also catching on. Imagine how job aids and training could improve with some really juicy infographs.  More and more companies are adopting ‘data-driven decision making’.  Heck, even the government is getting in on the data.

What it all boils down to is the content. Then, placing the content into a design that really assists the viewer to ‘read’ the information in a ‘nonlinear manner’. Good infographics make the viewer think-they don’t interpret the information for the viewer.

Filed Under: 21st Century Learning Skills, critical thinking, Infographics Tagged With: 21st Century Learning Skills, critical thinking, Inforgraphics

The Higher Education Bubble

February 8, 2012 by izzy

In May 2011, Peter Thiel—PayPal co-founder, venture capitalist, and a member of Facebook’s board of directors—predicted that higher education would be the next bubble to burst. According to Thiel, higher education in America bears the same markings as the technology and housing bubbles that preceded it: unbridled investment, wildly overvalued assets, and a lower rate of return than in years past. Like all economic bubbles, Thiel argues that higher education is destined for disaster.

I am ALL for higher education and these infographics and video give us all pause to think through the costs of education. Online education can help trim costs and offer an excellent education.

Education News

Education News

Created By: Education News

Filed Under: critical thinking, Higher Education, Infographics Tagged With: critical thinking, Higher Education, Inforgraphics

Why Inforgraphics Matter

October 11, 2011 by izzy

The Value of Data Visualization makes a compelling case for how infographics exploit visual clues like color, size, and graphic orientation to help us understand complex stories. Naturally, they use infographics to do it. Think about visual clues when creating instructional design.

The Value of Data Visualization from Column Five on Vimeo.

Filed Under: Communication, Design, Education, Infographics Tagged With: Communication, Design, Education, Inforgraphics

Turning Social Media On Its Side

September 25, 2011 by izzy

The surprise star at Facebook’s f8 conference was Nicholas Felton, whom Facebook’s head product developer credited with inspiring the layout of the revamped Facebook.  How’d that happen?

“His work was a huge inspiration on a lot of the big ideas that we presented today,” Facebook VP of product Christopher Cox said yesterday. It was the f8 developers’ conference, and Cox was talking about Timeline, the hotly anticipated third-generation redesign of Facebook’s profile page. Timeline exchanges Facebook’s standard single-column, scroll-down format for a more horizontally oriented tile-based interface that’s designed like a “scrapbook-on-steroids,” as my colleague E.B. Boyd put it.

If Timeline is successful, it could alter how people absorb data not just on Facebook, but also on the rest of the Internet (making a lot of money in the process). How? Simply by turning everyone into Nicholas Felton.

Timeline aims to turn Facebook into even more of a central hub for your life.

Right now, your Facebook page discriminates against the past. That’s a design problem: Click on someone’s profile, and all you see are their latest updates, their latest likes, and their latest photos. You have to scroll and scroll and scroll to get any sort of sense about who someone is over any time period larger than a day. Facebook, according to Cox, was struggling to solve this problem before Felton came aboard: A prototype that he nodded to in his presentation, at a glance, seemed cluttered and busy.

Timeline, by contrast, includes an actual timeline, organized in tiles across two columns like a virtual noteboard, that lets you present your autobiography from birth to now. You do it in your own words and with your own pictures, which means you’re free to highlight the milestones (the wedding, say) and bury the embarrassing moments (the bachelorette party). Then you top it off with a mega-huge panoramic photo of yourself or, for the camera-shy among us, a “unique image that represents you best,” to quote the site.

The tiles within your timeline can also include apps: One for tracking your music (and letting others listen to it as well through Spotify), and another to track the movies you watched (with Netflix), and another to track the number of miles you ran, and even the precise route you ran (with Nike+). In short, it centralizes and publicizes all of the details in your life that you never fully log.

Filed Under: Design, Facebook, Infographics Tagged With: Facebook, Infographics

© 2024 Mary Wiseman Designs. All Rights Reserved. Webspinner Msondevshop.graphics